Everything you need to
build, test, deploy & maintain
Expert guidance at every stage — delivering speed to market, quality, security, and sustainable long-term maintenance.

Linaro Products
Build reliable and optimized code for the right results on multiple Server and HPC architectures, including the latest x86-64 and 64-bit Arm CPUs, and GPUs from Nvidia and AMD.
Linaro Forge combines
Market leading, simple to use HPC debugger for C/C++, Fortran and Python applications.
Learn MoreEffortless performance analysis for experts and novices alike across diverse applications and platforms.
Learn MoreEach of the above are also available as standalone products.
Why Linaro Forge for your HPC workloads
From laptops to supercomputers and future architectures. Effortlessly detect memory bugs, profile behavior, and view advanced performance metrics on x86-64, 64-bit Arm CPUs, and GPUs from Nvidia and AMD.
Simplify complex debugging with an intuitive GUI, offering zero-click variable comparisons, built-in memory debugging, and array visualizations, perfect for today's parallel processors, both online and offline.
A comprehensive suite of performance indicators, including MPI metrics, PAPI counters, and IO metrics, alongside custom metrics.
Effortlessly profile C++, C, CUDA, Fortran, and Python applications with typically less than 5% runtime overhead—no code changes needed.
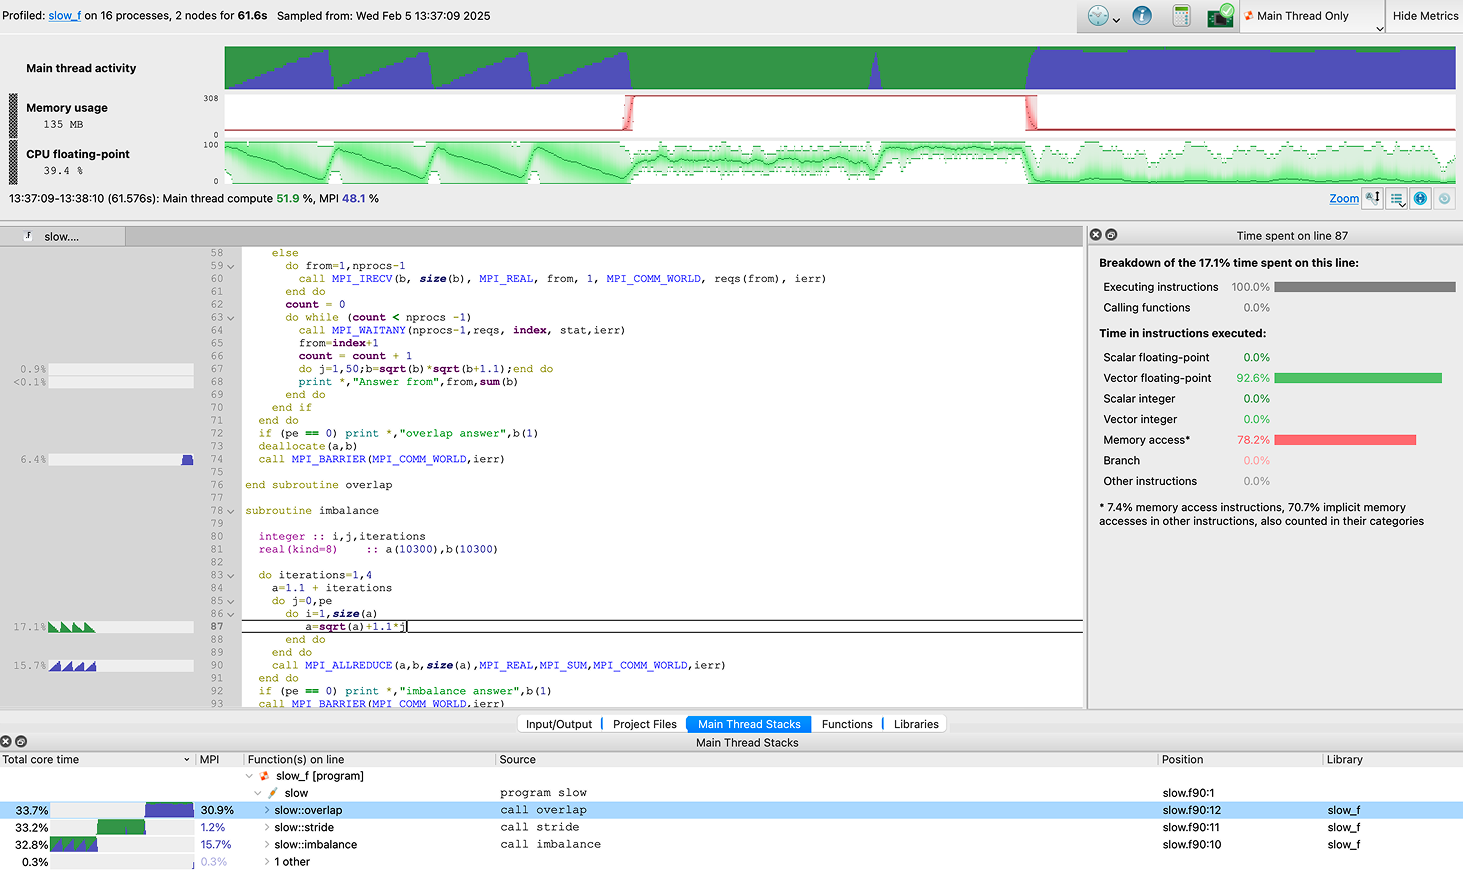
Comprehensive profiling for C, C++, Fortran, F90, and Python codes, pinpointing bottlenecks down to the sourceline. It uniquely profiles pthreads, OpenMP, and MPI, addressing parallel, multithreaded, and single-threaded code challenges, including communication and workload imbalances.
The premier debugger for C++, C, and Fortran parallel applications on CPUs and GPUs, favored for a powerful graphical interface that simplifies the detection of memory bugs and divergent behavior.
Best for HPC Solutions since 2003
Forge Resources


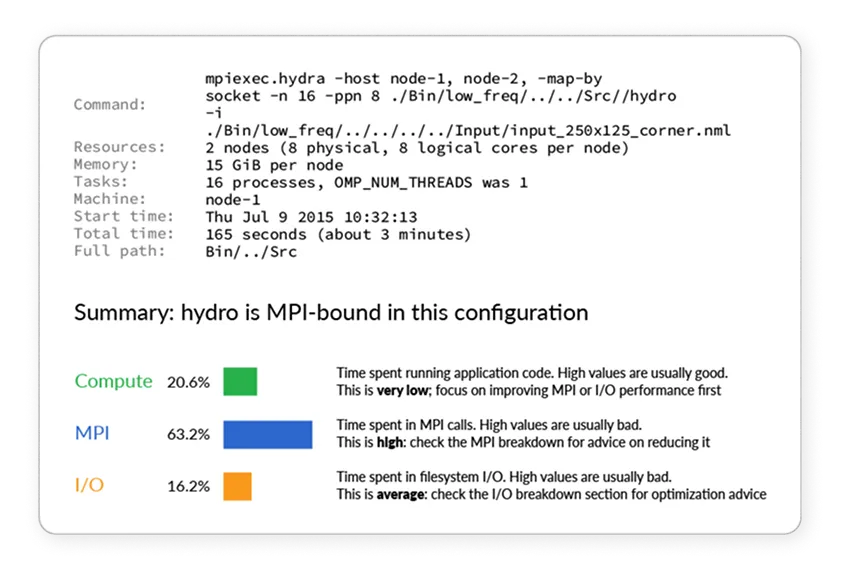
Linaro MAP is a high-performance profiler designed to optimize the efficiency of software running on multicore processors.


Linaro MAP allows you to profile your code without distorting application behaviour, enabling you to profile realistic test cases with typically less than 5% runtime overhead.

Linaro MAP generates in-depth analysis and bottleneck pinpointing to the source line, allowing you to quickly identify issues and optimize performance.

Linaro MAP provides a wide range of performance indicators, including MPI metrics, Perf counters, I/O metrics and memory usage to further help you ensure your performance is always being optimized.
The world's most powerful debugger for parallel applications. DDT lets you inspect, control, and fix bugs across massive MPI, OpenMP, and GPU workloads — all from a single intuitive interface.
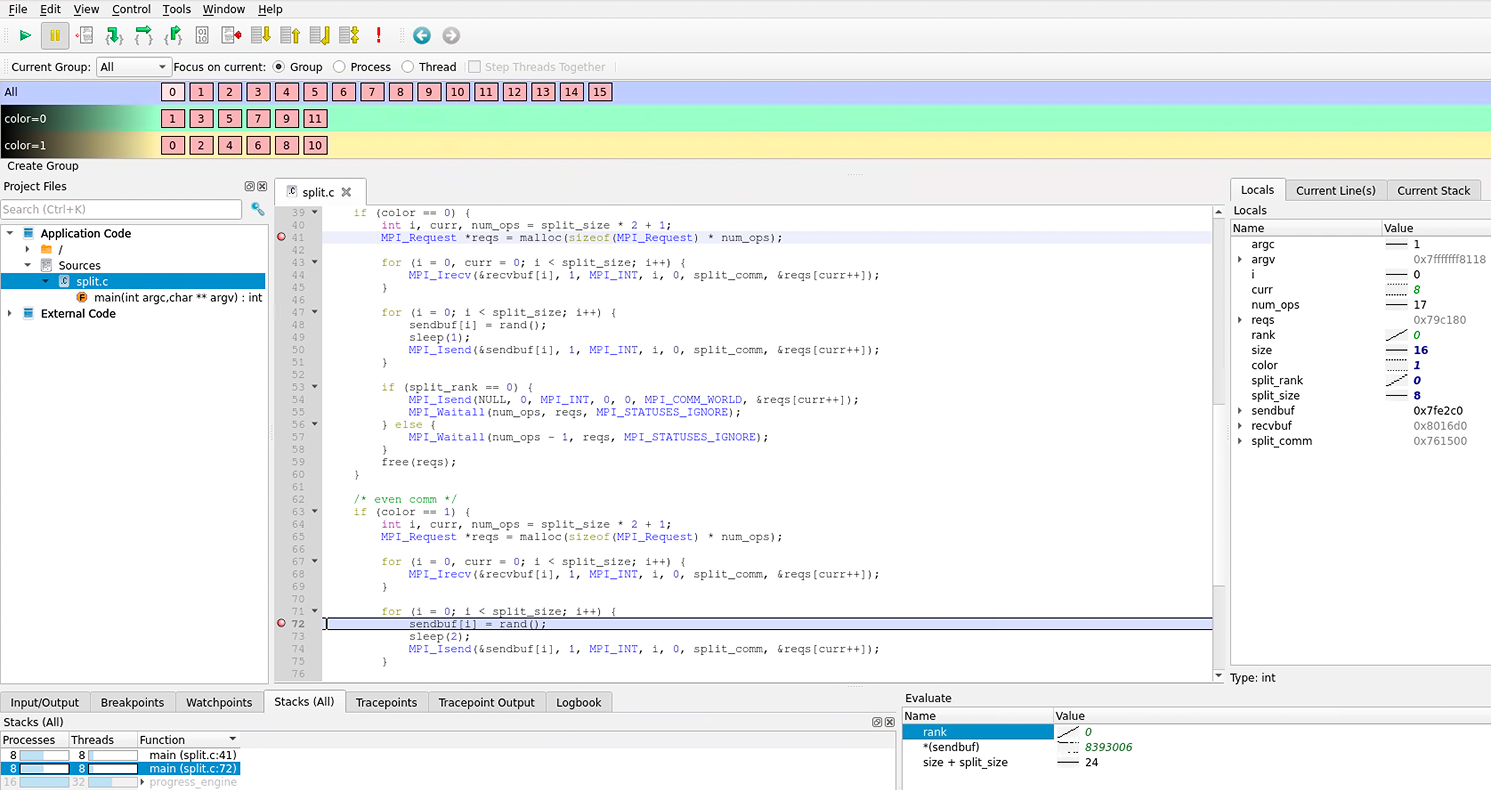


Linaro DDT's powerful intuitive GUI takes the complexity out of debugging software through its array of visualizations, enabling you to quickly get up to speed and save precious time.

Linaro DDT supports x86-64, 64-bit Arm CPUs, and GPUs from Nvidia, Arm and Intel, allowing you to stay productive at all times.

Once you start using Linaro DDT, you will gain access to training materials and direct email access to our support team to ensure you keep up to date with debugging best-practices.