

See exactly where your JVM spends its time.
JProfiler combines high-level analytics with low-level JVM data to pinpoint performance bottlenecks, memory leaks, slow database queries, and costly HTTP calls — all in one intuitive interface.
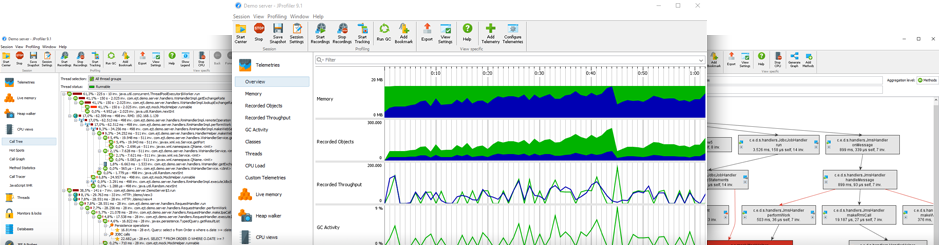
Trusted by developers at 30,000+ companies · 75%+ of all Fortune 500 firms profile with JProfiler
Explore JProfiler
Ten views into how JProfiler helps you understand and optimize your Java applications.
Easy Usage
Having a reliable tool to analyze your applications is crucial, but having the right tool matters even more. Instead of spending hours figuring out how a tool works, JProfiler makes it simple and intuitive from the start. Its session structure is straightforward, integrates smoothly with third-party tools, and presents analysis results in a clear, natural way. JProfiler is thoughtfully designed to help you solve problems at every level.
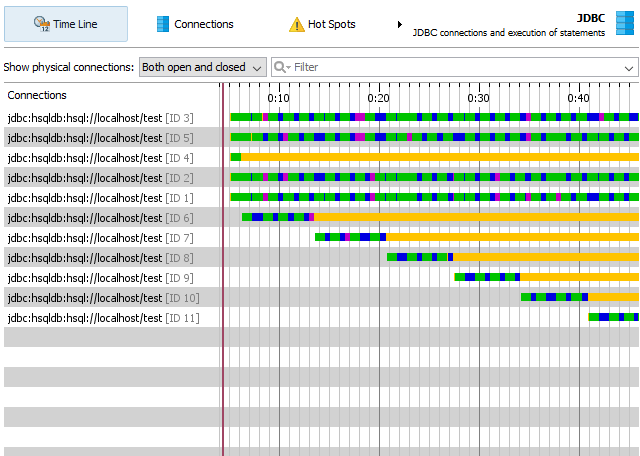
Database analysis for JDBC, JPA, and NoSQL
The leading cause of performance issues in business applications is database calls. JProfiler's JDBC, JPA/Hibernate, and NoSQL probes (MongoDB, Cassandra, HBase) pinpoint access delays and inefficient calls from your code. With hotspot, timeline, connection, telemetry, and event views, JProfiler's database probes are essential for analyzing your application's database layer.
Support for Java EE
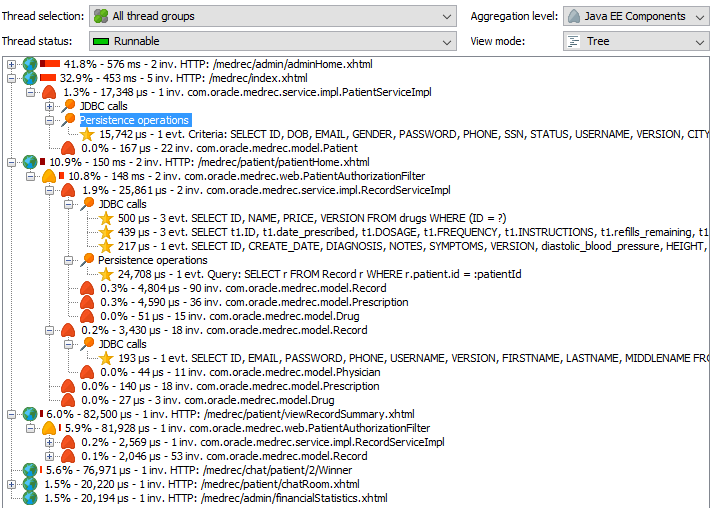
JEE features are visible across most of JProfiler's views. For example, at the JEE Aggregation level, you can see the call tree of JEE components in your application. In addition, CPU profiling adds a higher semantic layer to low-level analysis data, surfacing calls like JDBC, JPA/Hibernate, JMS, and JNDI directly in the view. With JEE support, JProfiler bridges the gap between low-level code profiling and high-level JEE monitoring.
High-level analysis data
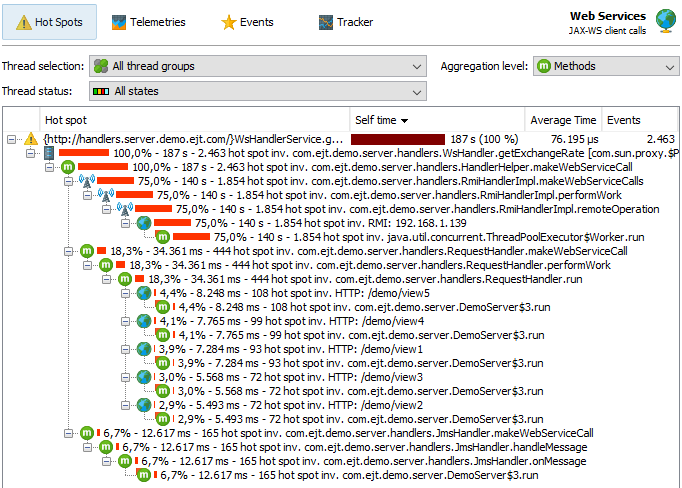
JProfiler provides many probes that display higher-level data from Java EE subsystems, such as JDBC, JPA/Hibernate, JSP/Servlet, JMS, Web Services, and JNDI. It also displays high-level info for RMI calls, files, sockets, and processes. Each probe has a dedicated view for analysis, highlighting issues, and tracing events. These views are also available for custom probes, configurable on-the-fly.
Memory Leak Analysis
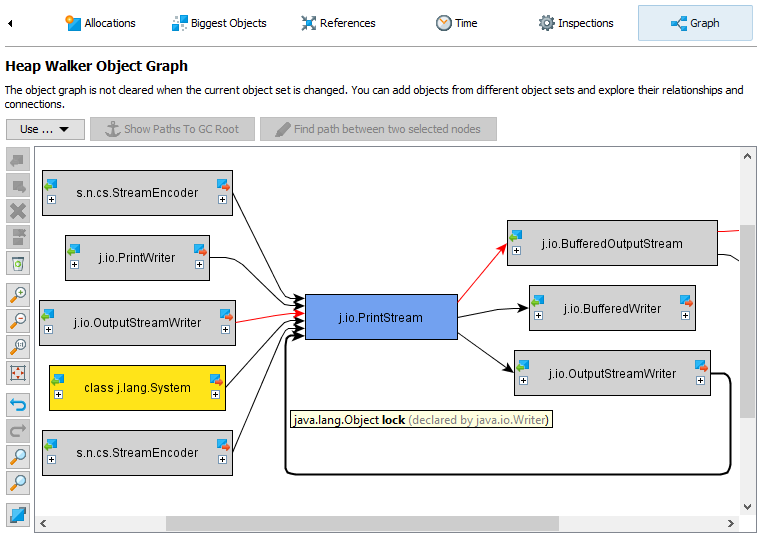
Without the right tools, finding a memory leak is nearly impossible. JProfiler's Heap Walker solves even complex memory problems through an intuitive interface. Its 5 different views let you analyze a set of objects from multiple angles. Each view allows you to examine the selected objects and switch seamlessly to a different set for further analysis.
QA functions
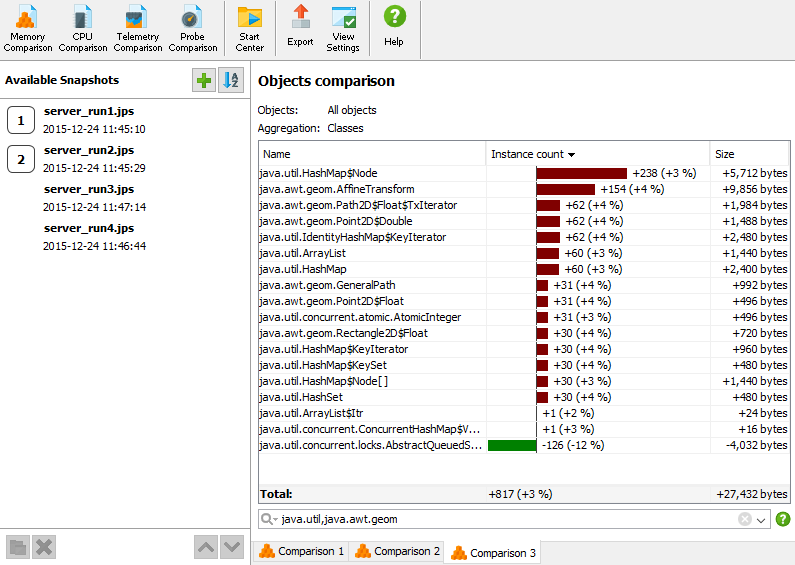
JProfiler isn't just a development tool, it's built for QA as well. Rich snapshot comparison features make it easy to track down problems. JProfiler also strongly supports command-line operations, letting you export and compare snapshot data directly from the command line. The bundled Ant task lets you run all these command-line operations right from your build script.
Supports a variety of platforms (IDEs and application servers)
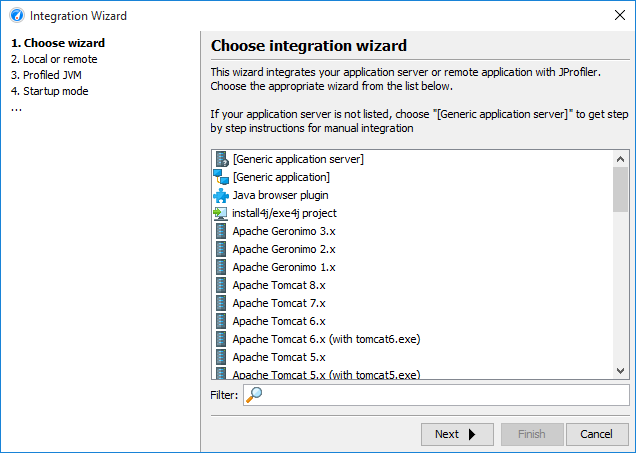
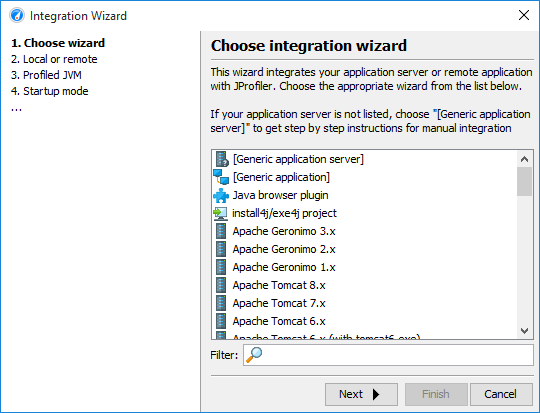
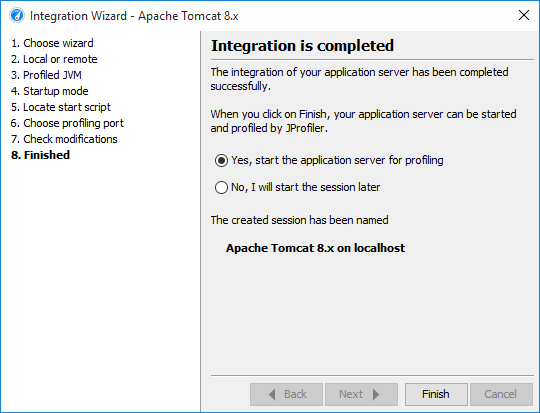
JProfiler provides a native agent library for a wide range of platforms (32-bit/64-bit JVM). With broad IDE integration, profiling can be seamlessly performed during application development. Its integration wizard lets you get started on almost any common application server in just a few clicks, no need to dig through documentation.
Reduced overhead
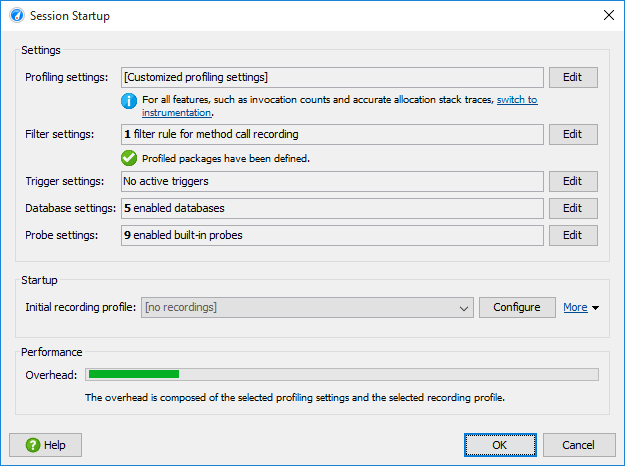
JProfiler lets you record data only when you need it. Start your application with the JProfiler agent and attach the GUI later, as long as you're not actively recording, overhead stays minimal. This is on-demand profiling. Advanced settings let you fine-tune parameters and see exactly how each affects performance, while ready-made templates let you quickly select settings for common use cases.
Powerful CPU Analysis Profiler
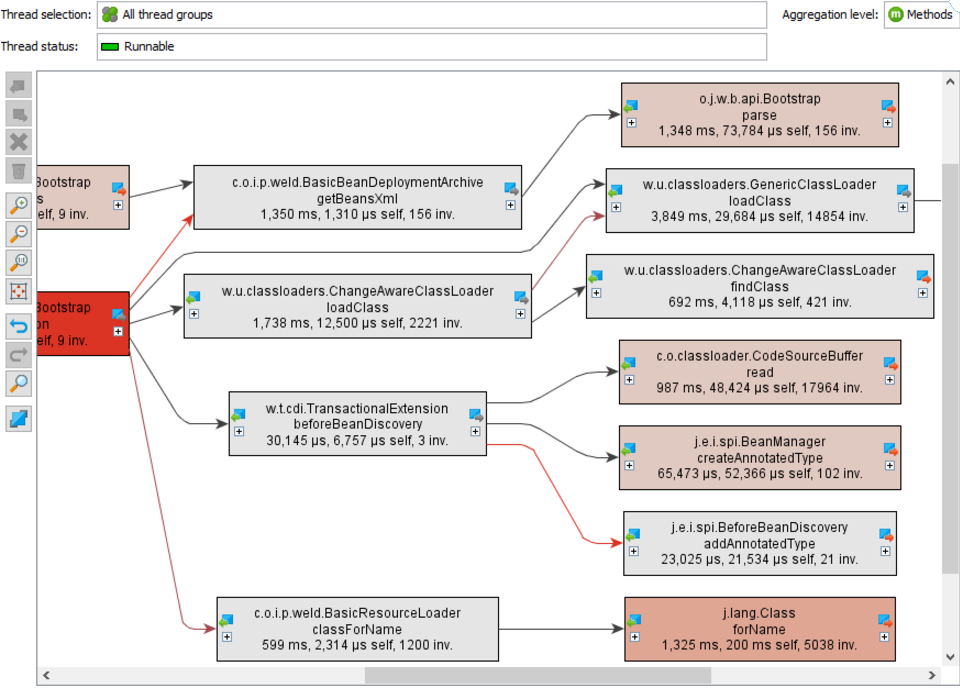
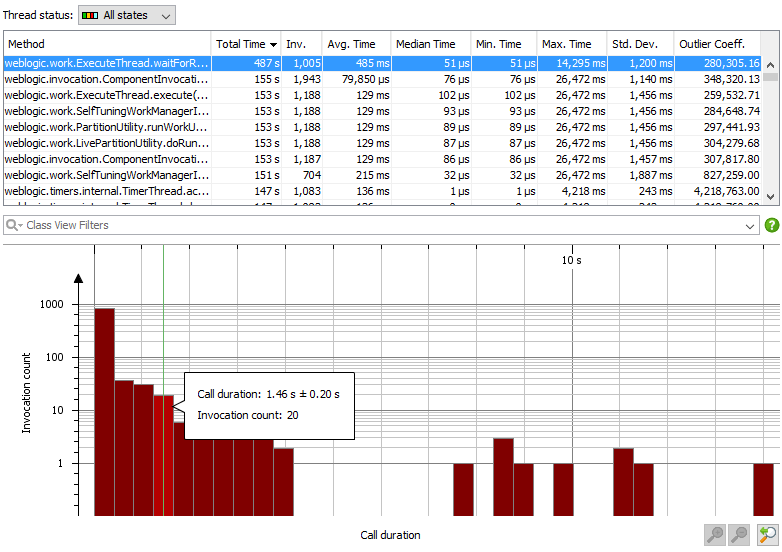
Eliminating performance bottlenecks is a classic use case for an analysis tool. However, since CPU data can be overwhelmingly detailed, the way that data is collected greatly affects usability. JProfiler addresses this with features like the call tree view filter, aggregation levels, and thread status selector, giving you critical advantages when tracking down the root cause of a problem.
Thread Profiler Integration
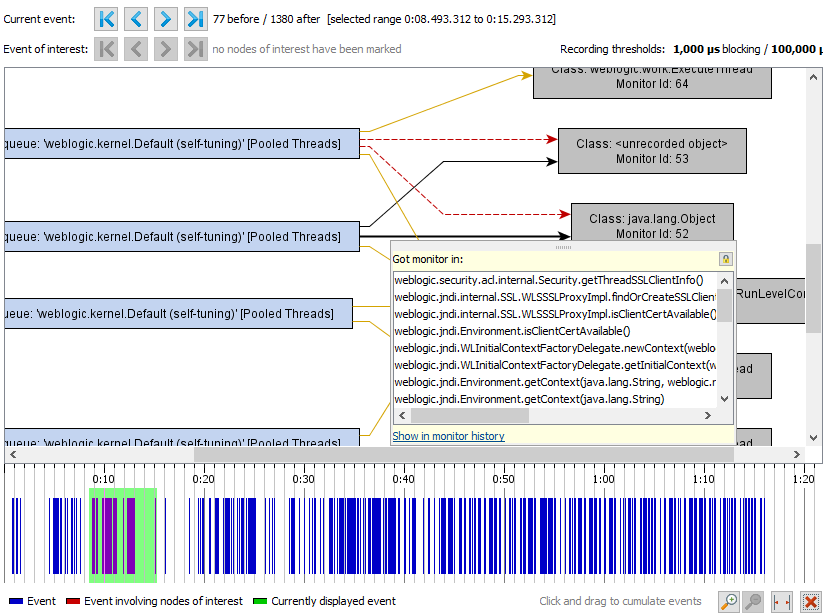
Thread problems occur more often than you'd imagine, and without a thread profiler, they're extremely difficult to solve. JProfiler reveals the performance of multithreaded applications bogged down by excessive locking, helping you handle issues that other tools simply can't - including deadlocks. You can view thread profiling through multiple dedicated views, as well as integrated directly with CPU profiling.
JProfiler Features
Dynamic analysis of local sessions
Once you define how your application is launched, you can profile it in JProfiler, and you can immediately see the live data of the JVM. You don't need to configure the session, and you can analyze applications from your favorite IDE through the IDE plugin.
Dynamic analysis of remote sessions
If you change the VM parameters of the java start command, you can listen for connections from the JProfiler GUI in Java applications. The profiled application can be executed on the local computer, as well as JProfiler You can also attach it to the application over the network. In addition, JProfiler provides an integration wizard for any major application servers for configuring the profiling application.
Offline Analysis and Triggers
You do not need to connect the JProfiler GUI to your application during profiling. In the offline analysis function, JProfiler's powerful trigger system or API can be used to control the profiling agent and save the snapshot to disk. Open these snapshots in the JProfiler GUI later, or command You can also export the profiling view programmatically using the Line Export Tool or Export ant task.
Comparison of snapshots
JProfiler allows you to save a snapshot of the current analysis data on disk. There is a comparison function that allows you to see changes between 2 or more snapshots. You can also create a comparison report programmatically using the command-line comparison tool or the comparison ant task.
HPROF View Snapshots
JProfiler allows you to open HPROF snapshots triggered by JVM tools such as josnole and jmap, as well as by the -XX:+ HeapDumpOnOutOfMemoryError JVM parameter.
Request Tracking
The innovative concept of request tracking makes it very easy to analyze parallel and multi-threaded programming. Request tracking uses a hyperlink in the call tree view to connect the calling site to the execution site between different threads. The following multi-threaded You can track the system.
java.util.concurrent Package Execution Program
AWT Event
SWT Events
Start of thread
In addition, if both JVMs are profiled and open in JProfiler, you can track calls across JVM boundaries. You can track the following remote calls:
RMI Call
Web service call
Remote EJB call
Creating a custom probe
JProfiler provides a custom probe wizard that allows you to directly define custom probes in the JProfiler GUI. Custom probes are deployed and customized to applications where JProfiler performs analysis There is no need to restart the application when changing or adding the probe. p>

Memory Profiling
The JProfiler's Memory Views section has a view that dynamically updates according to memory usage, and a view that displays information about the allocation hotspot. All views have multiple aggregation levels, live objects and garbage Displays the objects to be collected.

Heap Walker
JProfiler Heap Walker allows you to take a snapshot of the heap and execute the selection step to drill down on the target object. Heap Walker has 5 views:

CPU Profiling
JProfiler allows you to record call trees in a variety of ways to optimize performance. In all views, you can select a thread, thread group, and thread status. All views are methods, classes, packages, JEE It can be aggregated at each level of the component. The CPU profiling has the following views:

Thread Profiling
Thread profiling has the following views.

Monitor Profiling
Monitor Profiling has the following views.

VM Telemetry
To monitor the internal state of the JVM, the telemetry has the following views:

Databases
JProfiler supports specific probes in the following databases:
- The JDBC
- JPA/Hibernate
- MongoDB
- Cassandra
- HBase

List two title
JProfiler has the following probes:
- The JDBC
- JPA/Hibernate
- JMS
- JNDI
- RMI
- Web Services
- Saablet
- File
- Socket
- Process
In the probe, the following information is displayed.
System requirements
JProfiler runs on every major desktop platform and profiles applications on an even wider range of systems and architectures.
Platforms
The JProfiler GUI front-end must have a Java 11 VM. The jpenable, jdump, and jpcontrollers of the attach command-line tools require Java 6 VMs.
JProfiler supports profiling on the following platforms:
| OS | Archetecture | Supported JMVs |
|---|---|---|
| Windows 11, 10, 8, and 7 Windows Server 2022, 2019, 2016 and 2012 | x64/AMD64 | Hotspot 1.5 - 18 IBM/OpenJ9 1.5 - 18 |
| macOS 10.12 - 12 | Intel and Apple | Hotspot 1.7 - 18 OpenJ9 1.8 - 18 |
| Linux | x86 x64/AMD64 | Hotspot 1.5 - 18 IBM/OpenJ9 1.5 - 18 |
| Linux | PPC PPC64 PPC64LE | IBM/OpenJ9 1.5 - 18 |
| Linux | ARMv7 ARMv8 | Hotspot 1.6 to 18 |
| FreeBSD 12 and 13 | x86 AMD64 | FreeBSD 1.5 - 18 |
| AIX 7.1 - 7.3 | PPC PPC64 | IBM/OpenJ9 1.5 - 18 |
IDEs
The integration with IntelliJ IDEA was developed exclusively for ej-technologies by the IDEA plugin specialist at Fuhrer Engineering. For EAP builds, check with the IDEA Plugin Manager for a new version of JProfiler available.
JProfiler can be integrated into the following IDEs:
| IDEs | Windows | Linux | Unix | MacOS |
|---|---|---|---|---|
| Eclipse | ||||
| IntelliJ IDEA | ||||
| NetBeans IDE |
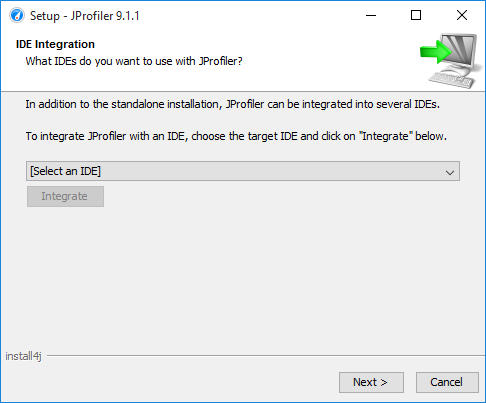
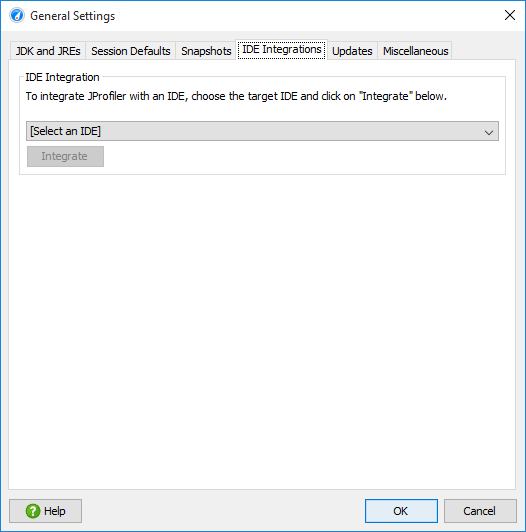
Table three title
Optional short description for the third table.
| Application Server | Windows | Linux | Unix | MacOS |
|---|---|---|---|---|
| Adobe Coldfusion MX 8, 9, 10, and 11 | ||||
| Apache Geronimo 1.x, 2.x, 3.x | ||||
| Apache Tomcat 5.x, 6.x, 7.x, 8.x, 9.x, 10.x | ||||
| Caucho Resin 3.x, 4.x | ||||
| Eclipse Virgo 2.x, 3.x | ||||
| Glassfish V1, V2, V3, 4.x, 5.x | ||||
| IBM Websphere 6.x, 7.x, 8.x, 9.x | ||||
| JBoss 4.x, 5.x, 6.x, 7.x | ||||
| Wildfly | ||||
| Jetty 5.x, 6.x, 7.x, 8.x, 9.x, 10.x | ||||
| ObjectWeb Jonas 5.x | ||||
| Oracle WebLogic Server 9.x, 10.x, 11g, 12c, 14c |
Get Started Today!
Explore our shop, and if you have any questions feel free to contact us!